Key Performance Indicators (KPIs)
The dashboard highlights three primary metrics to give you an immediate snapshot of your agent’s health:1. Tickets Created
This metric displays the total number of support tickets created by your chat or voice agents. It helps you track how many user issues or requests have been formalized into tickets for follow-up.2. Lead Generation
Tracks the total number of unique leads captured by your chat agent. A lead is typically created when a user provides contact information or engages in a meaningful interaction as defined by your Leads settings.3. Total Messages
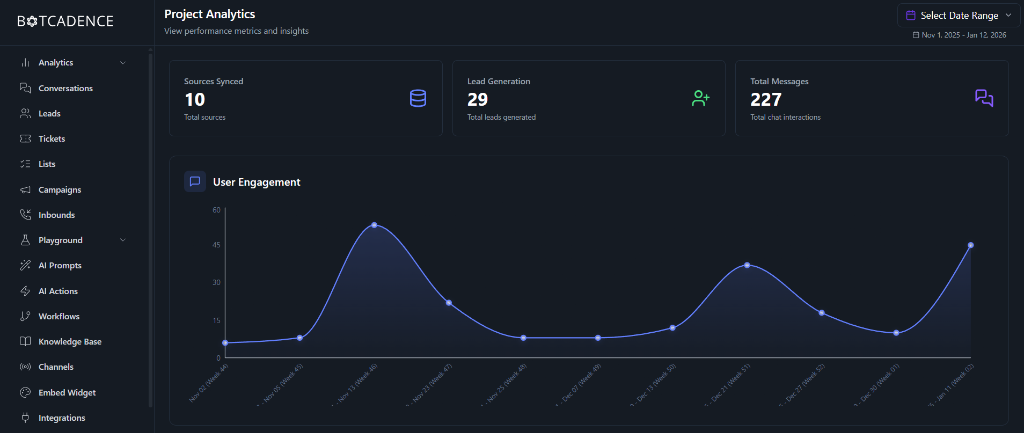
The cumulative number of messages exchanged between your AI agents and users. This is a primary indicator of how much your chat agent is being utilized by your audience.User Engagement
The User Engagement graph provides a visual timeline of chat activity. It helps you identify:- Peak Usage Times: Understand when your users are most active.
- Trend Analysis: See how engagement grows after deploying new features or marketing campaigns.
- Volume Spikes: Identify specific days where user inquiries were significantly higher than average.
Data Filtering
To refine your insights, use the Select Date Range tool in the top right corner. You can filter the data by:- Preset Ranges: Quickly switch between “Last 7 Days”, “This Month”, etc.
- Custom Range: Select a specific start and end date to analyze performance during a particular period.